

Azalea Asset Management is planning to launch Astrea VI, a new transaction in the series of asset back fixed income securities. The deal comes two years after Azalea launched Astrea V in June 2019.
In part 1 of our article, we provided our comments on the bond’s initial pricing guidance. We now proceed to share more on the portfolio’s composition, investment risks and structural safeguards.
Portfolio is over collateralized with a low LTV
The Astrea VI transaction is structured in a way such that the portfolio NAV is more than twice the value of the bonds issued. With potentially ~USD 643m of bonds at issuance and an NAV of USD 1,456.2m, the Astrea VI structure has a low LTV ratio at ~44.2%.
Class A bonds, which are ranked more senior to Class B bonds, are expected to be issued at a conservative loan-to-value ratio of ~35.3%. This means that the portfolio has to lose ~65% of its NAV before Class A bondholders are impacted. However as explained earlier, the risk of the portfolio losing ~65% of its value is very low as the Astrea VI portfolio consists of mature and seasoned funds.
General observations about the Astrea transactions
After the success of Astrea III, the Azalea group continued to launch Astrea IV and Astrea V in 2018 and 2019 respectively. As seen in Table 3, Astrea VI has the lowest LTV at launch at ~44.2%. The LTVs for previous transactions have mostly stayed around 45%, which is a conservative level.
The structure of Astrea VI is nearly identical to Astrea V. Unlike the earlier transactions, Astrea VI has just one asset-owning company as the manager was able to achieve the same level of tax reporting efficiency without the need for setting up two asset-owning companies.
Table 1: Trustees, creditors and LTVs of various Astrea transactions
|
Transaction |
Astrea VI |
Astrea V |
Astrea IV |
Astrea III |
|
Loan-to-value at inception |
~44.2% |
45.3% |
45.6% |
44.7% |
|
Number of asset-owning companies |
1 |
2 |
2 |
2 |
|
Issuer |
Astrea VI Pte. Ltd. |
Astrea V Pte. Ltd. |
Astrea IV Pte. Ltd. |
Astrea III Pte. Ltd. |
|
Sponsor |
Astrea Capital VI Pte. Ltd. |
Astrea Capital V Pte. Ltd. |
Astrea Capital IV Pte. Ltd. |
Astrea Capital Pte. Ltd. |
|
Credit Facility Provider(s) |
DBS Bank Ltd. |
DBS Bank Ltd. and Standard Chartered Bank |
N.A. |
N.A. |
|
Capital Call Facility Agreement |
N.A. |
N.A. |
DBS Bank Ltd. |
N.A. |
|
Liquidity Facility Agreement |
N.A. |
N.A. |
DBS Bank Ltd. |
Credit Suisse AG, London |
|
Bonds Trustee |
DBS Trustee Limited |
DBS Trustee Limited |
DBS Trustee Limited |
DBS Trustee Limited |
|
Security Trustee |
DB International Trust (Singapore) Limited |
DB International Trust (Singapore) Limited |
Perpetual (Asia) Limited |
DB International Trust (Singapore) Limited |
| Source: Company filings, iFAST compilations | ||||
Similar to Astrea IV and Astrea V, Class A-1 bonds are available to retail investors but at a minimum subscription sum of SGD 2,000 under the public offer. Once the retail bonds are listed on the Mainboard of the Singapore Exchange, investors may trade the bonds in multiples of SGD 1,000.
Looking at past transactions, the Astrea PE bonds have been very well received by investors. The aggregate offering for Astrea III was more than 8x subscribed, while the aggregate offering for Astrea V was subscribed by more than 6x. There was also strong demand for previous Astrea retail bonds. For instance, the Astrea IV (issued in 2018) and Astrea V (2019) retail bonds were more than 7.4x and 4.5x subscribed respectively.
Table 2: Astrea PE bonds and their respective issue amounts
|
Transaction |
Astrea VI |
Astrea V |
Astrea IV |
Astrea III |
|
Size of Class A-1 bonds (USD m) |
~285 |
230 |
181 |
170 |
|
Size of Class A-2 bonds (USD m) |
~228 |
230 |
210 |
170 |
|
Size of Class B bonds (USD m) |
~130 |
140 |
110 |
100 |
|
Size of Class C bonds (USD m) |
70 |
|||
|
Made available to |
Institutional, accredited and retail investors |
Institutional, accredited and retail investors |
Institutional, accredited and retail investors |
Institutional and accredited investors |
|
Demand at launch |
TBA |
Aggregate offering more than 6x subscribed, retail offering 4.5x subscribed |
Aggregate offering more than 5x subscribed, retail offering 7.4x subscribed |
Aggregate offering more than 8x subscribed |
| Source: Company, Astrea bond prospectus, iFAST compilations | ||||
Each Astrea transaction has a portfolio of more than 33 PE funds with exposures to a large number of investee companies. With a weighted average vintage year of 2014 and 802 investee companies, Astrea VI has USD 155.6m of uncalled capital commitments and an NAV of USD 1,456.2m at launch, making the Astrea VI structure most comparable to Astrea V as seen in Table 3.
Table 3: Portfolio statistics of the Astrea transactions at launch
|
Transaction |
Astrea VI |
Astrea V |
Astrea IV |
Astrea III |
|
Number of private equity funds in portfolio |
35 |
38 |
36 |
34 |
|
Number of investee companies |
802 |
862 |
596 |
592 |
|
Number of general partners |
28 |
32 |
27 |
26 |
|
Weighted average vintage year |
2014 |
2014 |
2011 |
2009 |
|
Uncalled capital commitments (USD m) |
155.6 |
215.0 |
168.1 |
201.4 |
|
Capital commitments (USD m) |
1357.6 |
1376.4 |
1752.9 |
1557.3 |
|
Portfolio NAV (USD m) |
1456.2 |
1324.4 |
1098.4 |
1141.6 |
| Source: Company, iFAST compilations | ||||
Underlying fund strategies
Majority of the Astrea portfolios are invested in buyout PE funds. Referring to Table 4, nearly 80% of the funds in Astrea V and Astrea VI are backed by cash flows from funds employing a buyout strategy.
Table 4: Strategy breakdown of the Astrea portfolios at launch (as a % of total NAV)
|
Transaction |
Astrea VI |
Astrea V |
Astrea IV |
Astrea III |
|
Buyout |
81.3 |
81.0 |
86.1 |
76.9 |
|
Growth equity |
18.7 |
19.0 |
12.3 |
23.1 |
|
Private debt |
1.6 |
|||
|
Total |
100 |
100 |
100 |
100 |
| Source: Company, iFAST compilations | ||||
The buyout private equity strategy involves the purchase of controlling stakes in the securities of investee companies. In the example of a leveraged buyout strategy, the general partner finances the acquisition of the investee company with some amount of debt. The assets and cash flows of the company generally act as collateral for the debt. In other situations, a buyout fund manager acquires stakes in listed companies with the intention of delisting them and taking them private.
Growth equity is another prevailing fund strategy among the Astrea portfolios. As the name suggests, the growth equity fund manager invests in companies that are in a strong growth phase. These investments typically consist of minority stakes in an investee company with restricted use of acquisition leverage. Fund managers aim to exit their investments through a company sale at a higher valuation or by listing their stakes in an initial public offering on a stock exchange.
Lastly, private debt managers issue debt securities to companies facing liquidity constraints or provide capital to firms who are unable to access debt capital markets. These securities are often ranked in between senior debt and equity of the borrower’s capital structure with embedded warrants or conversion rights. Private debt managers may also purchase distressed debt bonds with the aim of taking control of the investee company.
Figure 1: Median net IRR return by strategy
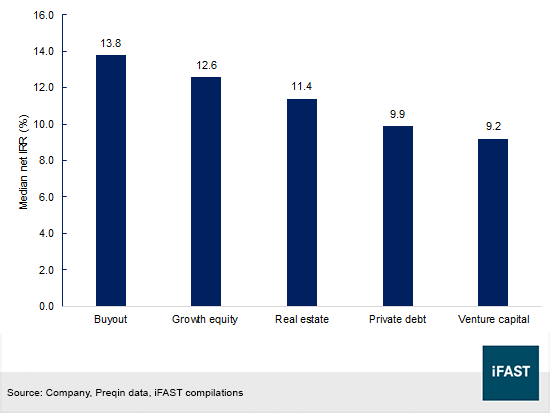
Following a study mentioned in the recent company filing, historical PE fund returns extracted from Preqin showed that buyout and growth equity fund mandates outperformed peer strategies between 1990 and 2016. During this period, buyout and growth equity funds registered median net internal rate of returns (“IRRs”) of 13.8% and 12.6% respectively, exceeding IRRs of real estate, private debt and venture capital funds (Figure 1).
However, the performance of buyout funds and the S&P 500 Index is highly correlated as the entry and exit valuations of private equity companies are closed linked to the public market valuations. As such, even though the net IRRs provide a top-line overview of PE fund returns, investors should note that there are periods between 1990 and 2016 at which private equity markets underperformed public markets.
Underlying regional and sector exposures at launch
Table 5: Geographical allocation at the investee company level (% of portfolio NAV)
|
Transaction |
Astrea VI |
Astrea V |
Astrea IV |
Astrea III |
|
North America |
50.9 |
49.3 |
55.8 |
54.2 |
|
Asia |
20.0 |
24.6 |
21.9 |
25.3 |
|
Europe |
26.0 |
22.8 |
19.5 |
18.5 |
|
Rest of the World |
3.1 |
3.3 |
2.8 |
2.0 |
|
Total |
100 |
100 |
100 |
100 |
| Source: Company, iFAST compilations | ||||
With regard to geographical exposures, we observed that most of the investee companies within the Astrea VI portfolio are located in North America (50.9%), followed by Europe (26.0%) and Asia (20.0%). This is synonymous with the regional breakdown of global PE assets under management (“AuM”). US focused PE funds have largely represented more than half of the global fund AuM since 2000. Nonetheless, in recent years, European and Asian mandates have increased their market shares of global fund AuM as they have experienced respective growth rates of 12.2% and 26.0% since 2000.
Table 6: Largest sector allocation at the investee company level (% of portfolio NAV)
|
Transaction |
Astrea VI |
Astrea V |
Astrea IV |
Astrea III |
|
Information Technology |
28.2 |
23.9 |
22.9 |
22.0 |
|
Consumer Discretionary |
13.2 |
15.3 |
21.3 |
23.4 |
|
Industrials |
12.4 |
14.4 |
11.9 |
14.5 |
|
Healthcare |
19.8 |
17.6 |
10.7 |
14.3 |
|
Financials |
7.7 |
Not in the top 5 sectors |
10.2 |
10.4 |
|
Communication services |
Not in the top 5 sectors |
8.0 |
Not in the top 5 sectors |
Not in the top 5 sectors |
| Source: Company, iFAST compilations | ||||
Investee company sector allocations reveal that Astrea portfolios have all invested in information technology companies, which is also the largest sector allocation across the four portfolios. Information technology and consumer discretionary firms represented the largest allocations within the Astrea III and Astrea IV portfolios, while healthcare and information technology sectors accounted for the biggest investments in the Astrea V and Astrea VI portfolios.
Stress test results
Bella Research Group, LLC was appointed to conduct an independent review of the Astrea VI portfolio. Bella Research Group is a well-recognized research consulting firm who has provided various solutions to participants in the private markets since 2010.
To determine the repayment ability of the Astrea VI transaction portfolio in various stress scenarios, a number of Monte-Carlo simulations was performed to generate thousands of PE fund portfolios. The performance of these portfolios was then assessed under different stress test scenarios to evaluate the debt payment capability of the issuer.
During the simulation exercise, Bella Research created a template of 35 PE funds to mimic the number of PE funds in the Astrea VI transaction portfolio.
There were four scenarios in the stress test. In the Base Case scenario, the portfolios were unconstrained and comprised of randomly selected funds. Under the scenario of Reduced Distributions, Bella Research assumed that all gross fund distributions from the Base Case fell by 50% in the first two years and then by 25% thereafter.
In the Below Median scenario, PE funds with performances lower than the median were selected for the simulation. Lastly in the Great Financial Crisis (“GFC”) and Reduced Distributions scenario, portfolios were tested as if they were active during the GFC period. PE funds were assumed to be launched in 2007 and 2008, followed by a 25% fall in all quarterly distributions.
Table 7: Percentage of portfolios that met principal repayment obligations
|
Scenarios |
Class A-1 bonds |
Class A-2 bonds |
Class B bonds |
||
|
By scheduled call date |
By maturity date |
By scheduled call date |
By maturity date |
By maturity date |
|
|
Base Case |
99.98% |
100.00% |
99.98% |
100.00% |
100.00% |
|
Reduced Distributions |
99.85% |
100.00% |
82.60% |
100.00% |
99.77% |
|
Below Median |
99.91% |
100.00% |
96.01% |
100.00% |
100.00% |
|
GFC and Reduced Distributions |
99.61% |
100.00% |
72.47% |
99.07% |
91.29% |
| Source: Company, Bella Research Group, LLC, iFAST compilations | |||||
After conducting the simulation exercise and with those hypothetical situations in mind, the study concluded that majority of the simulated portfolios were able to generate ample cash flows to meet bond principal repayments.
In the GFC and Reduced Distributions scenario (also known as the most adverse scenario), 99.61% of the portfolios had the ability to repay Class A-1 bonds by their scheduled call dates. Similarly, 72.47% of portfolios were able to redeem Class A-2 bonds by their scheduled call date in March 2026 (see Table 7). All in all, the conclusion from the study proved that there is a high probability that the PE funds in the Astrea VI portfolio would repay bondholders on their call or maturity dates.
Investment risks in bonds backed by private equity
Nevertheless, there are associated risks with investing in Astrea VI PE bonds. Cash flows for the bonds stem from private equity and this is an illiquid asset class. Unlike securities in the public market, there is no active market to trade shares in private companies. The timing of capital calls is also unpredictable and pose a funding risks to private equity investors. Limited partners may not meet their capital commitments even though they are contractually binding.
The process of finding an exit opportunity for private equity, be it in the form of a secondary market sale or an initial public offering, may take years and may be exacerbated in periods of market declines. Consequently, PE bond investors may not receive interest or principal if there are zero PE fund distributions or if distributions remain low for a long time.
Second, Astrea VI has a majority exposure in buyout funds. If most of the general partners in these buyout funds generate returns from the use of debt, bond investors face the risk of capital loss if market conditions turn bad. Investee companies may not generate sufficient cash flow to service debt especially in the midst of poor economic conditions and rising interest rates. Returns from investee companies may not be ideal and Astrea PE bond investors face a prospect of investment loss.
Third, with close to 30% of the portfolio in the technology sector, Astrea VI bond investors may also receive poor returns if there are any adverse regulation or rulings specific to information technology. Additionally, with equity valuations at a heightened level right now, general partners (“GPs”) may be overpaying for private companies if they were acquired right now. If there is too much capital chasing too few deals, PE funds may outbid each other to pay for top performing investee firms. If valuations for these companies fall in the next few years, GPs who bought them at a high may have difficulty selling their stakes for a gain. If GPs are unable to realize their investments by the bond’s repayment dates, Astrea VI bondholders will suffer a capital loss.
Reserves accounts
To mitigate theses investment risks, a number of structural safeguards have been put in place in the Astrea VI transaction to protect the interest of bondholders. For one, the setup of reserves accounts ensures that the issuer has enough capital to redeem all Class A bonds on their call dates. As mentioned, as long as the Class A-1 bonds remain outstanding, the issuer will set aside ~USD 51.3m – equivalent to a tenth of the principal amount of the Class A bonds in every distribution period.
When the Performance Threshold has been met (i.e. when the aggregate cash received by the sponsor exceeds ~USD 421m), payments to the reserves accounts will increase by half of the cash sweep to the sponsor thereafter. If Astrea VI has insufficient cash to satisfy the amount of ~USD 51.3m on any distribution date, the unpaid balance will carry forward to subsequent distribution dates until it is paid.
No further payments will be made to the reserves accounts upon the full redemption of the Class A-1 bonds. Astrea VI is required to redeem the Class A bonds if there are sufficient amounts in the reserves accounts and no credit facility loan remains outstanding. Once the Class A bonds are fully redeemed,, cash flows will be directed for the repayment of the outstanding principal of the Class B notes.
Credit Facility
Astrea VI may access a multicurrency revolving loan facility for various funding needs. The term of the facility starts from the issue date of the bonds to the day at which the Class B bonds are fully redeemed. Under the conditions of the facility agreement, the total amount available under the credit facility is capped at USD 300m at any point in time. Capital calls received at the asset-owning company may be funded through the loan facility, in the event of cash flow shortfalls. That aside, loan proceeds may be used to pay certain portfolio charges such as taxes, operating expenses, hedge payments, and management fees, in the event of cash flow shortfalls.
Astrea issuers have not drawn down on their credit facilities so far. The Astrea portfolios have performed well during 2020 in the midst of a virus outbreak and various economic headwinds. The highly diversified nature of the portfolios helped to mitigate the drop in valuations in the non-performing sections of the portfolios. Investors may refer to the article – “Astrea PE bonds are your go-to investments for private equity exposure ” – on the recent performance of Astrea IV and Astrea V.
Sponsor sharing
The Astrea VI transaction has a sponsor sharing feature, which allows a faster build-up of the reserves accounts to facilitate the redemption of Class A bonds on its expected redemption date. The sponsor is the parent and 100% equity owner of the issuer, implying that it is the first in line to absorb losses of the structure and the last person to receive liquidation proceeds in the event of a default.
There is strong alignment of interest between the sponsor and the Astrea bondholders. As an illustration, during the fourth Astrea IV distribution period in June 2020, the sponsor – Astrea Capital IV Pte Ltd - was entitled to remaining distributions of USD 53m after applying the priority of payment waterfall, but decided instead to channel the amount to the reserves accounts. As a result of the additional payment of USD 53m, the LTV ratio for the Astrea IV structure was reduced to 42.4% in June last year.
Maximum LTV ratio
Defined as the proportion of net debt over NAV, the calculated LTV ratio of the Astrea VI structure is not allowed to exceed 50%. In the event that the LTV ratio exceeds 50%, payments will be made (i) to the reserves accounts and repayment of Class B bonds so as long as the Class A-1 bonds are outstanding or, (ii) for the repayment of Class A-2 and Class B bonds once Class A-1 bonds have been paid down, until the LTV Ratio no longer exceeds 50%.
In conclusion
Given its diversified portfolio of funds, embedded structural safeguards and alignment of interest between the sponsor and bondholders, we think that stable-income seekers should invest in the Astrea VI bonds. Private equity is an asset class typically accessible only by institutions or high net worth individuals. There are high minimum investment sums required and PE investors tend to have long time horizons of up to 12 years. But the Astrea VI bonds are supported by cash flows from a large portfolio of private equity assets. The portfolio is made up of several hundred companies and is well diversified by sector, region, vintage and manager. We believe that the diversified nature of the portfolio and structural safeguards of the Astrea VI notes outweigh the downside risks, and would recommend the bonds at their respective IPGs.
Declaration: For specific disclosure, at the time of publication of this report, IFPL (via its connected and associated entities) and the analyst who produced this report hold a NIL position in the abovementioned securities.
Our podcast series, Yield Hunters, is available on Spotify, iTunes Podcasts and Google Podcasts.
In a time when bonds were (and still are) typically made available to institutional investors and HNW investors, Azalea Investment Management made headlines when they issued Astrea IV, the first ever Private Equity bond accessible to retail investors in Singapore.
In this episode, we speak with Lim Jun Jie, Associate Director at Azalea Investment Management to find out more about the Astrea bonds, how such private equity bonds work and how they can add value to our investment portfolios. Tune in below and follow us!